
Master Content Performance Analysis for Better Growth
Published on 2025-07-10
Let's be honest: just hitting "publish" and hoping for the best is a surefire way to waste your time and budget. Content performance analysis is what turns your content from a hopeful shot in the dark into a predictable engine for growth.
It’s all about digging into your content's impact to figure out what's actually working. This means moving beyond guesswork and using real data to make smarter decisions that lead to tangible results, like more leads and sales.
Why You Can’t Afford to Skip Content Performance Analysis

In a world flooded with content, the most successful marketers aren't the ones who just create the most stuff—they're the ones who obsess over the data. Having a system for content performance analysis is the single biggest thing that separates a high-growth marketing program from a content factory that just burns cash with nothing to show for it.
When you consistently analyze your performance, you bring a new level of clarity to your work. It proves your strategy is on the right track and gives you the hard evidence you need to justify your budget. By tying every blog post, video, or social update back to actual business goals, you can finally demonstrate your content's true value, far beyond simple vanity metrics like likes and shares.
Moving From Guesswork to Growth
Without analysis, you’re just making assumptions. You might feel like your audience loves in-depth articles, but the data could show that short, snappy videos are the real lead magnets. This is what performance analysis is all about: swapping out those gut feelings for cold, hard facts.
The numbers don't lie. As of early 2025, a staggering 82% of companies were using content marketing. What's more, 76% of marketers say it helps them generate leads, and 72% credit it for driving more engagement. The trend is obvious: businesses aren't just creating content anymore; they're measuring it to win. If you're curious about the data, you can dive deeper into how these brand performance analysis trends are shaping the industry.
The real point of content performance analysis isn't to make pretty charts. It’s to find those golden nuggets of insight that make your next piece of content even better than your last.
The Core Pillars of Content Performance Analysis
To build a solid analysis process, it helps to think in terms of four core pillars. Each one has a clear purpose, guiding you from messy data to smart, strategic action. This framework helps ensure you don't miss a thing.
This table breaks down the foundational components of a solid content analysis framework, clarifying what you need to do at each stage.
| Pillar | Objective | Key Question to Answer |
|---|---|---|
| KPI Definition | Align content metrics with business goals. | What does success really look like for this content? |
| Data Collection | Gather accurate performance data. | Where can I find the numbers I need to prove this? |
| Insight Generation | Find the "why" behind the numbers. | What story is this data trying to tell me? |
| Strategic Optimization | Use insights to improve future content. | How can I use what I’ve learned to get better results next time? |
Mastering these four pillars will give you a repeatable system for not just measuring your content, but consistently improving it.
How to Set KPIs That Actually Drive Growth
It’s incredibly easy to get distracted by vanity metrics. We all love seeing a post rack up hundreds of likes, but let’s be honest—do those likes actually translate into business? The whole point of content performance analysis is to move past the feel-good numbers and define Key Performance Indicators (KPIs) that are directly tied to your goals.
Before you dive into your analytics, take a step back and ask yourself a simple question: What am I actually trying to accomplish here? The answer will completely change which numbers you care about. Are you trying to build brand awareness, generate solid leads, or drive people to a sales page? Each of these goals has its own set of meaningful KPIs.
Connecting Metrics to Real Business Objectives
Let's walk through a real-world example. Say you're a B2B consultant using LinkedIn to find your next client. Your main goal is pretty clear: lead generation.
A "like" on your latest post is what I'd call a diagnostic metric. It tells you people saw your content and had a fleeting positive reaction. That's nice, but it doesn't pay the mortgage. The real business-impact metrics are the actions that show someone is getting serious about working with you.
For a lead generation goal, your most valuable KPIs would be things like:
- Profile Clicks: Did your post make someone curious enough to check you out? That’s a strong signal of genuine interest.
- Website Clicks: If you linked to a case study or a contact page, how many people made that jump? This is a direct measure of traffic from your efforts.
- Inbound Connection Requests with a Message: This is the gold standard. How many people reached out and specifically mentioned your content? You can’t get a much warmer lead than that.
When you start tracking these actions, your entire mindset shifts. You stop asking, "How many people liked this?" and start asking, "How many potential clients did this post bring me?" It's a fundamental change in perspective.
Separating Signal From Noise
Thinking this way forces you to cut through the noise and focus on what truly drives results. It's the discipline that separates marketers who are just posting content from those who are building a real business asset. And the financial proof is there—worldwide content marketing revenue is on track to hit a staggering $107.5 billion by 2026. This boom is being driven by people who understand their metrics; in fact, 63% of marketers say their content has significantly boosted customer loyalty because they focus on what matters. You can dig deeper into these content performance statistics from recent studies.
The trick is to establish a clear hierarchy for your metrics. For every piece of content, pick one or two primary KPIs that align perfectly with its purpose. Everything else—likes, shares, comments—becomes secondary. They provide helpful context, but they don't steer the ship. This keeps your analysis sharp and ensures your efforts are always aimed at activities that deliver real, measurable business value.
Assembling Your Data Collection Toolkit
 You can't do great analysis without great data. That’s a given. But building a system to collect that data doesn't mean you need a bunch of expensive subscriptions. The truth is, you can run a powerful content performance analysis with free, powerful tools you probably already use.
The trick is knowing where to look and what information to grab. Your aim is to build a dependable system that gives you the numbers you need without becoming another full-time job. It all starts by tapping into the native analytics tools already at your fingertips.
Start with Native Analytics
Your first stop should always be the analytics dashboards built right into the platforms themselves. For a LinkedIn strategy, this means getting comfortable with LinkedIn Analytics. Think of it as your home base for understanding post reach, engagement, and who your followers actually are.
When it comes to your website or blog, Google Analytics is the undisputed champ. It gives you a deep-dive into how people find your content and what they do once they get there.
So, where should you focus? Here’s what I look at first:
- LinkedIn Post Analytics: I check the performance of individual posts to see impressions, clicks, comments, and reposts. This is the fastest way to learn which topics and formats are hitting the mark with my audience right now.
- LinkedIn Follower Analytics: Keeping an eye on follower growth is important, but the real gold is in the demographics. Are you attracting people with the right job titles, industries, and locations? This tells you if your targeting is on point.
- Google Analytics Acquisition Reports: This report answers a simple but vital question: how are people finding you? Is it organic search, social media, or referrals? You need this data to know which channels are actually working.
- Google Analytics Engagement Reports: Metrics like Average Engagement Time tell you if your content is genuinely interesting. A high number here means people are sticking around to read what you've written, which is exactly what you want.
It's easy to get lost in the sea of data. Don't. Let your KPIs be your guide. If your main goal is generating leads, a high Average Engagement Time on a detailed case study is infinitely more valuable than a spike in views on a quick, viral-style post.
Create a Single Source of Truth
Jumping between different analytics platforms is a huge time-suck and just plain inefficient. As you get more serious about your content performance analysis, you'll want to pull your most important data into one central place. This is where a tool like Looker Studio (what used to be Google Data Studio) becomes a game-changer.
You can connect data sources like Google Analytics and a simple spreadsheet with your LinkedIn data to build a custom dashboard. Suddenly, you have a single screen showing your key KPIs across all your channels. This not only saves you a ton of time but also makes it way easier to spot trends you'd otherwise miss.
For example, you might see that a specific LinkedIn post drove a lot of website clicks, which then led to a high conversion rate on a particular landing page. That’s a powerful insight that’s nearly impossible to uncover when your data is scattered everywhere.
A well-organized dashboard turns a jumble of metrics into a clear story. This is the foundation for smart social media content planning that actually gets results.
Turning Raw Data into Actionable Strategy
Let’s be honest: raw data is just a pile of numbers. It doesn't mean anything until you figure out the story it's trying to tell. This is where the real work of content performance analysis begins—translating those figures into a smarter, more effective content strategy for LinkedIn. It’s about moving past simply reporting on metrics and starting to see the "why" behind your results.
Your job is to play detective. Why did one post get a ton of profile clicks while another was a ghost town? What made that one topic spark a lively comment section but generate zero leads? Answering these kinds of questions is how you turn simple observations into powerful optimizations.
It’s a straightforward flow from collecting data to making strategic moves that actually get you somewhere.
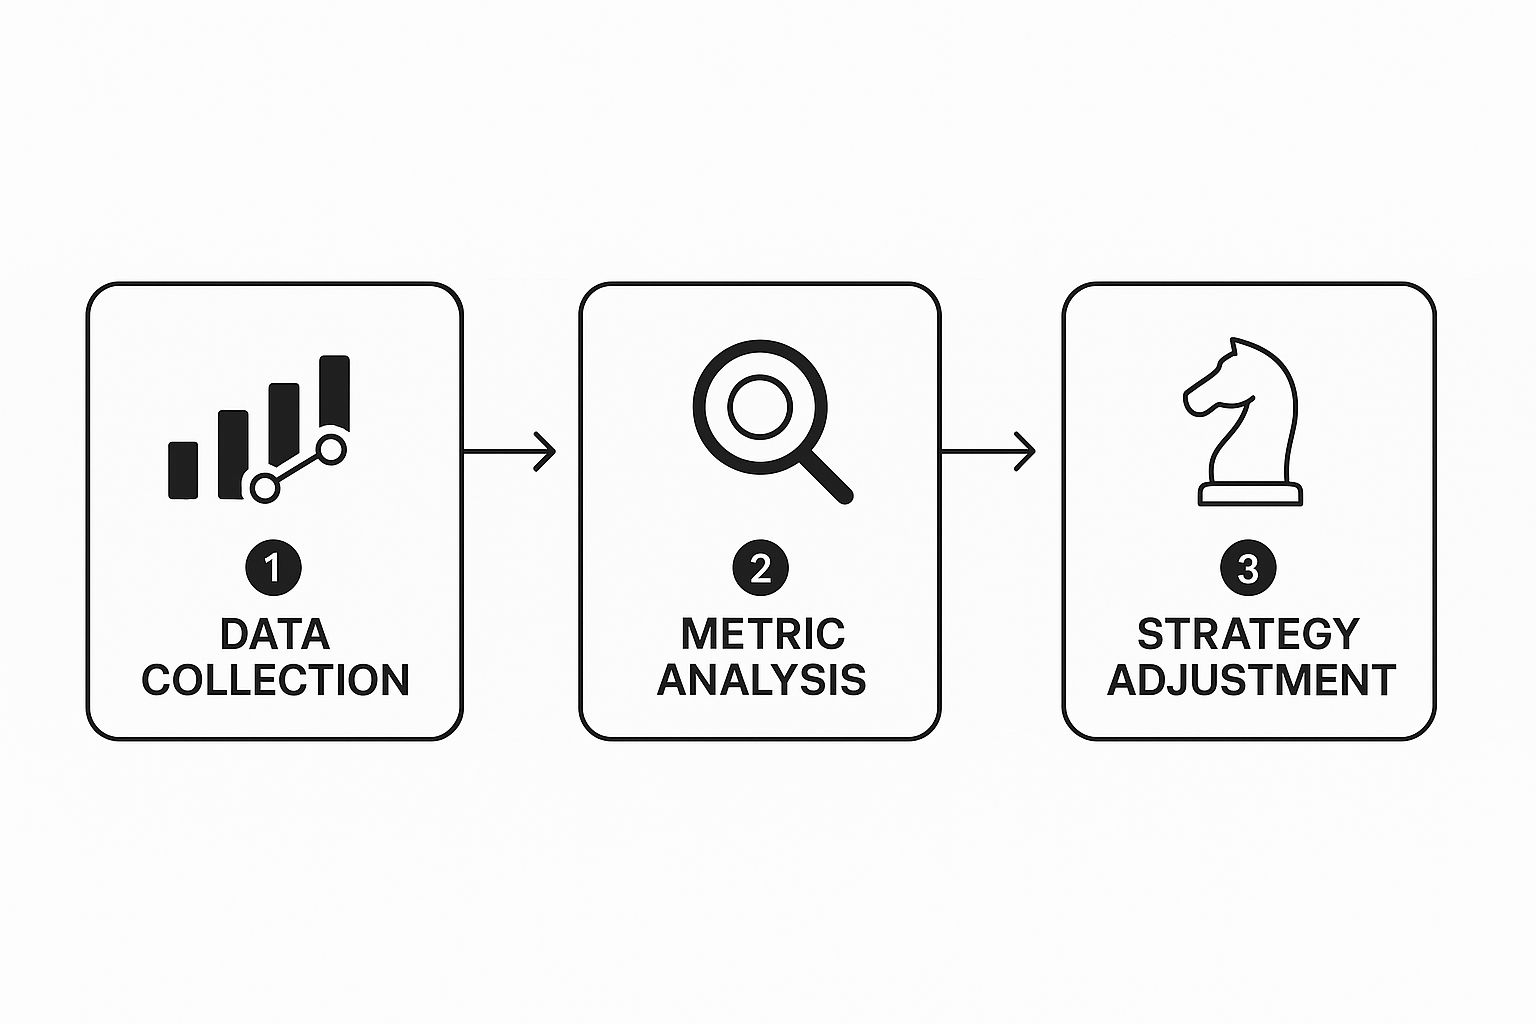
The main thing to remember is that analysis is the bridge connecting what happened with what you’ll do next. It's a continuous loop, not a one-and-done report you glance at once a month.
From Data Points to Strategic Direction
Okay, let's get practical. Imagine you've just pulled your LinkedIn data for the last month. You've got your core lead generation KPIs in hand—profile clicks, website visits, and new connection requests. Now, it's time to slice and dice that data to find the hidden patterns.
You can break down your analysis in a few really insightful ways:
- By Content Format: Pit your text-only posts against your carousels, images, and videos. You might discover that carousels get fantastic engagement, but it’s the simple text posts that are sliding into your DMs.
- By Content Topic: Group your posts by theme. Did your content on project management tips blow your leadership advice out of the water? This tells you exactly what your audience is hungry for.
- By Call to Action (CTA): Did asking a direct question drive more comments than asking people to click a link? Analyzing your CTAs shows you which prompts actually get your audience to take action.
This kind of segmentation is where the magic happens. You’re no longer staring at a confusing wall of numbers. Instead, you're looking at smaller, comparable data sets that tell a much clearer story.
Don’t just focus on your wins. Seriously, spend just as much time analyzing what failed. A post that bombed is an invaluable lesson in what your audience doesn't care about, saving you from wasting time and effort on that topic or format again.
Connecting Metrics to Real Insights
Once you’ve segmented your data, you can start drawing a straight line from the numbers to what you should do next. This is how you build a powerful feedback loop that makes your content better and better over time.
This table gives you a clear example of how to translate what you see in your LinkedIn analytics into actionable next steps for your content.
Connecting Metrics to Insights: a LinkedIn Example
| Observation (The Data) | Potential Insight (The 'Why') | Actionable Next Step |
|---|---|---|
| Carousel posts had the highest average engagement time. | The interactive, step-by-step format kept readers swiping and engaged. | I should create more carousels that break down complex topics into simple, digestible slides. |
| My text-only post about a personal failure got 2x more comments than average. | It seems vulnerability and authentic storytelling really resonated, building a personal connection. | I'll try weaving more personal anecdotes into my posts to build trust and encourage conversation. |
| Posts with links to my company blog had low click-through rates (CTR). | My audience prefers to stay on LinkedIn; external links might feel too much like a hard sell. | Instead of just dropping links, I'll repurpose blog content into native formats like LinkedIn articles or carousels. |
Following this process ensures your strategy is data-informed, not data-dictated. You're using real evidence to sharpen your creative instincts. To go even deeper, you can learn more about building a solid writing strategy that bakes these kinds of insights in from the very beginning. This transforms performance analysis from a reactive chore into a proactive tool for growth.
How to Use AI for Smarter Content Analysis

Let's be real: artificial intelligence is way more than just a buzzword. Think of it as a practical assistant ready to supercharge your content performance analysis. AI tools are brilliant at automating the tedious parts of the job and finding patterns you'd never spot on your own. This frees you up to focus on what you do best—high-level strategy and creative thinking.
For example, instead of spending hours scrolling through comments, AI can run an instant sentiment analysis. This gives you a quick, clear read on how your audience actually felt about your post, helping you see if your message landed the way you hoped.
Go Deeper Than Surface-Level Metrics
This is where AI really shines: making sense of mountains of qualitative data. Manually reading through hundreds of comments to spot common themes is a huge time-drain. An AI can do it in seconds.
Here are a few ways I’ve seen AI take analysis to the next level:
- Topic Clustering: AI can scan all your comments and group them by recurring themes. You might discover that a specific pain point you touched on is a major issue for your audience, which is a goldmine for future content ideas.
- Summarizing Qualitative Feedback: I often copy a long list of comments from a LinkedIn post and drop it into a tool like ChatGPT. I'll ask it to summarize the top three discussion points. It's a massive shortcut to actionable insights.
- Generating Data-Backed Hypotheses: Not sure why a post blew up? AI can analyze the content and suggest potential reasons. Maybe it was a specific emotional trigger word or the way you phrased a question. You can use these suggestions to form solid hypotheses for your next A/B test.
Using AI for content analysis isn't about replacing your judgment; it's about augmenting it. The goal is to get to the "why" faster so you can spend more time on creative and strategic decisions.
Integrating AI into Your Workflow
You don't need to completely overhaul your process to start using AI. Just start small. Think of it as having a junior analyst on your team who can help with specific parts of your content performance analysis.
The shift toward AI in marketing is happening fast. A June 2025 report found that 90% of content marketers plan to use AI, a big jump from 83.2% in 2024. And it's working: only 21.5% of marketers using AI said their strategies underperformed, compared to a much higher 36.2% for those not using it. Tools like ChatGPT are the most popular, with 77.9% adoption, mostly for brainstorming and outlining. You can dig into more of these numbers in these AI content marketing statistics.
The data is pretty clear: AI gives you a real competitive edge. It helps you move from just reporting numbers to actually predicting what your audience wants next. For instance, after you’ve identified your top posts, you can ask an AI to generate five new content ideas based on those same successful themes and formats.
Suddenly, you have a data-informed content pipeline that stands a much better chance of hitting the mark. By letting AI handle the heavy data lifting, you get the space you need to build a more resonant and effective content strategy.
Common Questions About Content Performance Analysis
https://www.youtube.com/embed/xx2ucfMS8dc
Once you start digging into your content analytics, a few questions almost always pop up. It's perfectly normal. Turning raw numbers into smart decisions is a skill, and running into these common roadblocks is just part of the process.
Let's clear them up so you can get back to what matters: making your content better.
One of the first things people ask is how often they should even be looking at their analytics. Honestly, it's not a one-size-fits-all answer. It really hinges on what you’re trying to achieve and where you're posting.
For a fast-paced platform like LinkedIn, a quick weekly check-in is a great rhythm. You can keep an eye on engagement and see what’s resonating right now. But for your bigger content plays—like your blog's SEO performance—a deeper monthly or quarterly review makes a lot more sense. The key isn't frequency, it's consistency. Settle on a schedule you can actually stick to, because that's how you'll spot the trends that truly matter.
What’s the Difference Between a Metric and a KPI?
This one comes up all the time, and getting it right is fundamental. It’s actually pretty simple.
A metric is just a number. It’s anything you can count—page views, likes, shares, email open rates. They’re all just measurements. Think of them as raw data points.
A KPI (Key Performance Indicator), however, is a metric you've specifically chosen because it directly reflects progress toward a key business goal. For instance, if your main objective is generating leads, your KPI isn't just website traffic; it's the conversion rate on your "Contact Us" form.
All KPIs are metrics, but not all metrics are KPIs. Your KPIs are the handful of metrics that you've decided truly define success for your business.
Making this distinction is how you cut through the noise. It keeps you focused on the numbers that actually drive growth, instead of getting distracted by vanity stats that look nice but don't mean much.
Can I Do Real Analysis Without Expensive Tools?
Yes, absolutely. Don't let anyone tell you otherwise. The most powerful tool you have isn't a pricey subscription—it's a clear process for looking at the data that's already at your fingertips.
You can build a surprisingly robust content performance analysis framework using nothing but free tools.
- Google Analytics is a goldmine for understanding your website traffic and how people behave once they get there.
- Google Search Console tells you exactly how your site is showing up in Google's search results and which queries are bringing people in.
- Native Social Analytics from platforms like LinkedIn or YouTube offer deep insights into post engagement, audience demographics, and video performance.
Once you’ve identified your top-performing content, you can use some clever content repurposing strategies to squeeze even more value from your winners without spending another dollar.