
Content Performance Metrics: Your Complete Guide to Success
Published on 2025-06-23
Making Sense of Content Performance Metrics
Diving into the world of content performance metrics can feel like you’re staring at a plane’s cockpit for the first time. There are countless dials, gauges, and flashing lights. But what do they all mean for your content's journey? It's easy to get fixated on the numbers that look impressive but don't actually tell you if you're flying in the right direction. This is a common trap: chasing vanity metrics instead of focusing on measurements that guide smart decisions.
Think of your content analytics as the vital signs for your marketing. A high number of page views might seem like a strong heartbeat, but it doesn't reveal if your audience is truly connecting with your message or just dropping in for a second and leaving. The goal is to learn how to read these signals correctly. This helps you understand not just if your content is getting views, but how healthy and effective it is at doing its job.
From Vanity to Value: A Shift in Perspective
The first step to making sense of your data is to sort your metrics into two main groups: vanity metrics and actionable metrics. Vanity metrics, like total social media followers or the number of times your content was shown (impressions), are easy to track and can feel good to share. However, they rarely connect directly to business goals. They might show your content is being seen, but they don't say much about genuine interest.
Actionable metrics, in contrast, give you a window into how your audience behaves and point to specific ways you can improve. These are the numbers that link your content to real business objectives, like generating leads or making sales. For example, your bounce rate—the percentage of visitors who leave after seeing just one page—tells you if your content is delivering on the promise of its headline. A high bounce rate could mean there's a mismatch between what people expected and what they found.
Reading the Story in Your Data
Every collection of content metrics tells a story about your audience. One of the most basic metrics is page views, which is simply the total number of times a page was loaded. While it's a simple count, it gives a broad idea of your content's reach and traffic volume, making it a good starting point for a deeper look. You can learn more about these foundational metrics and how they work by checking out expert guides on content performance.
But page views are just the opening chapter. To understand the whole story, you need to see how different metrics work together. Imagine a page with tons of views but a very low time on page. This suggests that while your headline grabbed attention, the content itself didn't hold it for long.
This snapshot shows more than just the number of users; it includes their average engagement time. This combination paints a much clearer picture of how interesting the content really is. By connecting these data points, you move from simply counting visitors to understanding their behavior—the foundation of a strong content strategy.
The Metrics That Actually Drive Your Content Forward
Not all data points are created equal. While it's tempting to celebrate every spike in traffic, some content performance metrics are just shiny distractions that don't help you reach your business goals. To really move your content program forward, you need to focus on the numbers that signal real success, not just the ones that feel good to look at. This means learning to tell the difference between what seems productive and what actually drives growth.
The key is to shift your attention from sheer volume to genuine interaction. Take bounce rate, for example—the percentage of visitors who leave after looking at just one page. It's often misunderstood. A high bounce rate on a product page could be a warning sign, but on a blog post that perfectly answers a user's question, it might mean your content was so effective that the visitor found what they needed and left happy. This is why a richer set of metrics is so important.
Moving Beyond Page Views to True Engagement
Instead of only asking, "How many people saw this?" we need to ask, "How did people interact with this?" This is where engagement metrics tell a much deeper story. Modern analytics platforms go beyond simple page views to measure things like total engaged minutes and average engaged time, giving a clearer picture of user interaction. To see how these advanced metrics work, you can check out in-depth guides on historical data.
When a reader spends several minutes on your article, it’s a strong signal that your content is valuable and holds their attention. This deep engagement is a powerful predictor of future actions, like subscribing to a newsletter, downloading a resource, or becoming a customer. High engagement is often a leading indicator of conversions.
This diagram shows the relationship between different types of metrics, from initial traffic to the final conversion.
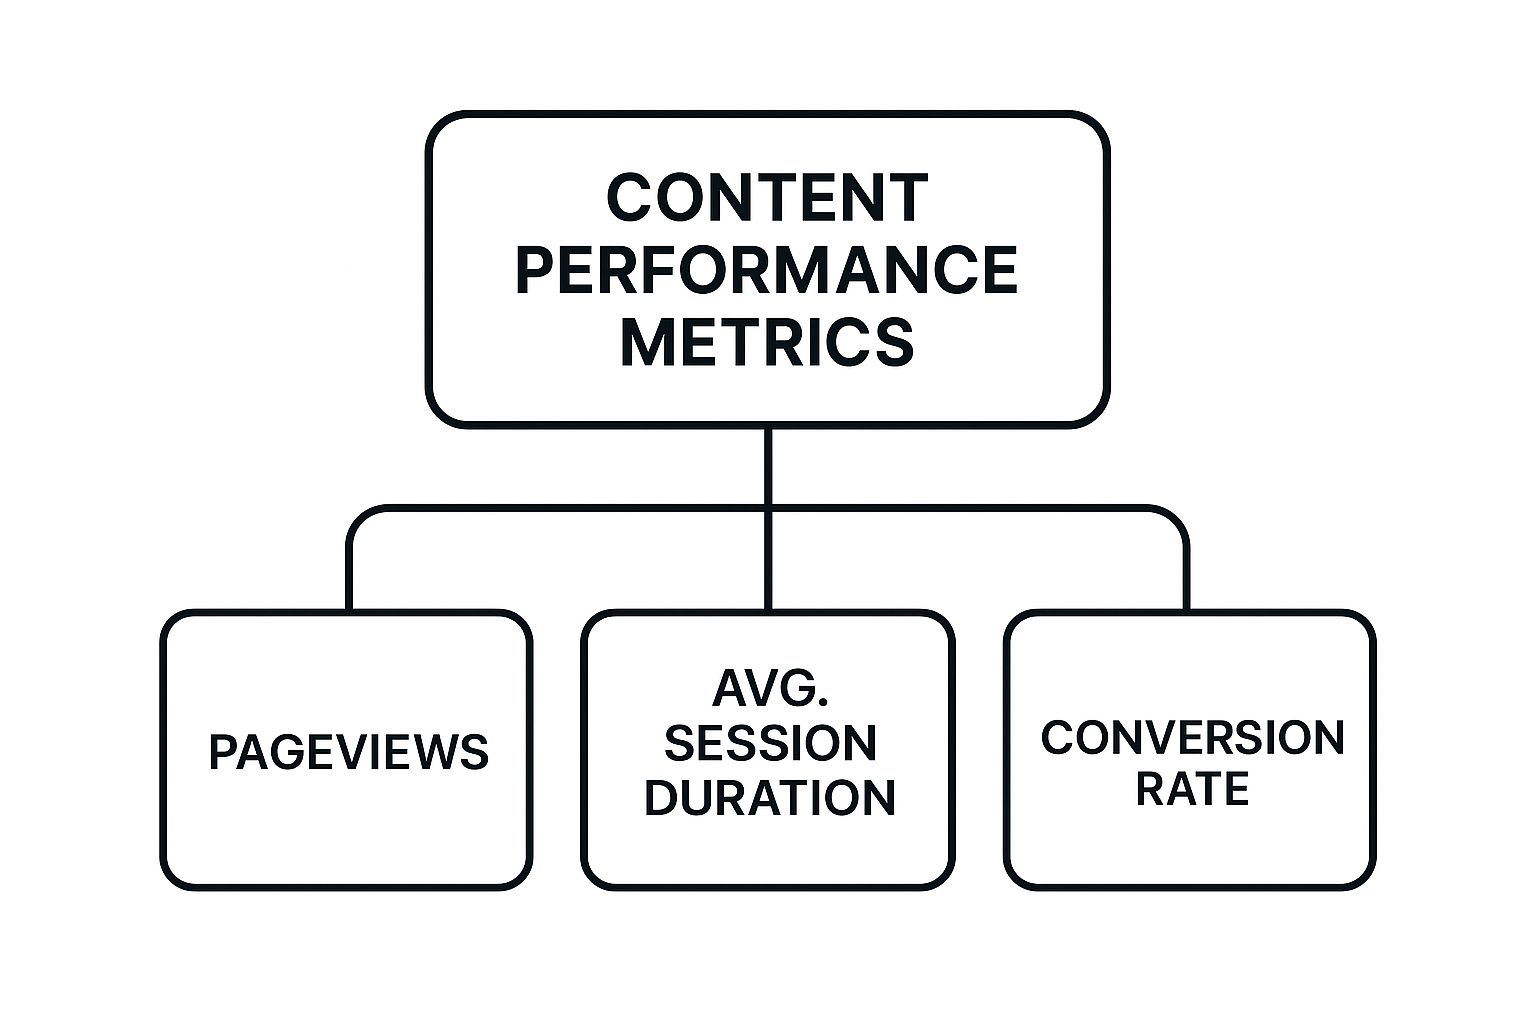
The image makes it clear that while pageviews are the starting point, the user journey continues through deeper engagement, leading to valuable conversions that directly affect your business's success.
To help you choose the right metrics, the following table breaks down some of the most essential ones, explaining what they measure and why they matter.
Essential Content Performance Metrics Comparison
A comprehensive comparison of key content metrics, their measurement methods, and business impact
| Metric | What It Measures | Business Value | Measurement Difficulty | Actionability |
|---|---|---|---|---|
| New Users | The number of first-time visitors to your content. | Indicates brand reach and audience growth potential. Essential for awareness goals. | Easy | High |
| Average Engaged Time | The average time visitors actively interact with a page (scrolling, clicking). | Signals content quality and relevance. High engagement often precedes conversion. | Medium | High |
| Conversion Rate | The percentage of visitors who complete a desired action (e.g., sign-up, download). | Directly measures content's ability to drive business goals like lead generation. | Medium | High |
| Backlinks | The number of other websites linking to your content. | Boosts SEO authority and signals that other sites find your content valuable. | Hard | Medium |
| Social Shares | How often your content is shared on social media platforms. | Shows content resonance and amplifies reach to new, related audiences. | Easy | Medium |
This table shows that while some metrics like New Users are easy to track, others like Backlinks require more effort but offer significant long-term value. The most actionable metrics, such as Conversion Rate and Average Engaged Time, directly connect content performance to business outcomes.
Identifying Your True North Metrics
The most important metrics depend entirely on what you want to achieve with a specific piece of content. Is your goal to build brand awareness, generate new leads, or help close sales? Your answer will point you to the right key performance indicators (KPIs).
- For Brand Awareness: Focus on metrics like new users, social shares, and backlinks. These show your content's reach and its power to attract a fresh audience.
- For Lead Generation: Keep an eye on conversion rates for forms, new contacts created, and the download numbers for gated content like ebooks or whitepapers.
- For Sales Enablement: Monitor how content influences the sales pipeline or the customer conversion rate for users who engaged with it. This reveals how your content helps guide prospects toward a purchase.
By matching your measurement strategy to your business objectives, you can cut through the noise and focus on the content performance metrics that genuinely predict and drive success. This targeted approach turns your content from a simple publishing task into a reliable engine for business growth.
Building Your Content Measurement Foundation
Tracking content performance metrics isn't about collecting data for its own sake; it's about getting clear, useful feedback. Think of it like building a custom dashboard for a car. You don't need every possible gauge. You just need the ones that tell you if you're heading in the right direction, how much fuel is left, and if the engine is running smoothly. A solid measurement foundation helps you make smarter content decisions, not just pile up more numbers.
Seasoned content managers know how to sidestep "analysis paralysis" by zeroing in on what's most important. The objective is to create a reporting system your team will actually use and to set up tracking that captures meaningful information. This journey begins with selecting the right tools for your specific goals.
Choosing Your Measurement Toolkit
The tools you choose will frame how you see and understand your data. The good news is you don't need a huge budget to get started. There are powerful, accessible options for teams of any size.
- Free and Accessible Tools: For nearly everyone, Google Analytics is the place to start. It’s free, powerful, and offers a wealth of data on user behavior, from page views to how long people stay on your site. Some platforms, like HubSpot, have built-in analytics that track metrics like New Contacts and Total Form Submissions, directly linking your content to lead generation.
- Specialized and Enterprise Solutions: As your content efforts expand, you might look into more specialized tools. These platforms can provide advanced features like detailed heatmaps (which show where users click), session recordings, or complex attribution models that reveal how your content contributes to sales over time.
For instance, a simple dashboard in Google Analytics can give you a clean overview of how people find your content and what they do once they arrive.

This type of report helps you quickly identify which channels bring in the most visitors, so you can focus your promotion where it will have the biggest effect.
From Data to Actionable Insights
Once you have your tools ready, the next step is to create a process that turns raw numbers into real content improvements. This isn't a one-time task but a continuous cycle of measuring, analyzing, and refining. A common pitfall is to set up tracking and then forget to check it, or worse, to look at the data without knowing what to do next.
To prevent this, establish a simple, regular reporting schedule. This could be a monthly review where you pinpoint your best and worst-performing content. Look for trends. Why did one blog post get so many shares? Why did another have such a high bounce rate? Asking these questions turns numbers into a story. The answers you find should directly feed back into your content strategy. For tips on how to organize these efforts, our guide on social media content planning offers some helpful frameworks. By building a strong foundation with the right tools and processes, you ensure your content performance metrics become a reliable guide for growth.
Learning From Your Content's Track Record

Every piece of content you publish leaves behind a trail of data. This track record is filled with clues about what your audience enjoys, what they find useful, and what they completely ignore. To get better results, you need to learn how to read this history. This involves more than just glancing at your newest blog post; it requires a systematic review of your entire content library. Think of it as being a detective for your own brand, searching for patterns that point to new opportunities.
The main goal is to figure out the "why" behind your content performance metrics. Why do some topics consistently get high engagement while others fall flat? Do you see a seasonal pattern in your traffic that you could plan for? Answering these questions turns historical data from a simple report card into a powerful predictive tool.
This approach helps you spot early signs of content fatigue, where your audience is growing tired of a certain topic or format, letting you switch things up before your metrics take a hit. It also helps you identify your evergreen content—the valuable articles that keep bringing in traffic months or even years after you first hit publish.
Identifying Your Star Performers and Hidden Gems
The first step in any historical analysis is to sort your content by performance. A simple way to do this is by creating three groups: top performers, average performers, and underperformers. You can define these tiers using key metrics that match your business goals, like average engaged time, conversion rate, or social shares. This quickly shows you which articles are your star players—the ones you should promote more, update, or use as a blueprint for future pieces.
Don’t just focus on the big wins, though. Your underperforming content can offer some of the most important lessons. Did an article fail because the topic was off, or was the headline just not compelling enough? Maybe it was published at the wrong time of year. Digging into these "failures" is often more educational than just celebrating your successes.
This is why looking back at past results is a cornerstone of modern content strategy. By examining metrics over long periods, teams can learn from what worked and what didn't. You can find more detailed advice on this topic by exploring how to analyze historical performance data in marketing.
A Framework for Actionable Historical Analysis
To make this process consistent and effective, it helps to use a structured framework. A systematic method ensures you pull clear, actionable insights from your data every time you sit down to review it.
The table below offers a straightforward framework for analyzing your content's historical performance. It breaks down what to look for, how often to look, and what to do with what you find.
Historical Content Performance Analysis Framework
Step-by-step framework for analyzing historical content data to identify trends and opportunities
| Analysis Type | Time Period | Key Metrics | Insights Gained | Action Items |
|---|---|---|---|---|
| Topic/Theme Analysis | Last 6-12 Months | Average Engaged Time, Social Shares | Identifies audience's favorite subjects and content pillars. | Double down on successful themes; deprioritize unpopular ones. |
| Format Analysis | Last 12 Months | Conversion Rate, Time on Page | Reveals which formats (e.g., listicles, guides, case studies) resonate most. | Create more content in high-performing formats. |
| Seasonal Trend Analysis | Last 24 Months | Page Views, Entrances | Uncovers predictable peaks and valleys in audience interest. | Plan content calendar to align with seasonal traffic patterns. |
| Content Decay Audit | All Time | Page Views, Backlinks, Keyword Rankings | Finds high-potential older content that is losing traffic. | Update and republish decaying posts to regain performance. |
This framework provides a clear roadmap for your analysis. By regularly performing these checks, you can shift from simply reacting to trends to proactively shaping your content strategy with data. You'll learn to anticipate what your audience wants, find quick wins by refreshing older content, and avoid making the same mistakes twice. This careful review of your content's past is the key to building a strong and consistently high-performing content program.
Transforming Data Into Content That Performs Better
Collecting content performance metrics is just the beginning; the real magic happens when you turn those numbers into action. Think of it as moving from reading a map to actually driving the car. You're shifting from knowing what happened with your content to understanding why it happened and how to make it better. This creates a powerful improvement cycle that keeps your content sharp and effective.
The journey from data to better results starts with figuring out which articles, videos, or posts deserve your attention. Not every piece of content needs a complete makeover. The goal is to spot both the underperformers that need a boost and the star players whose success you can replicate across your entire strategy.
Prioritizing Your Content for Optimization
To get the most out of your efforts, you need a smart way to decide what to work on first. Imagine your content library is a garden. Some plants are thriving, some are just okay, and a few are wilting. Your job is to figure out where to spend your time and resources—your water and fertilizer—for the best harvest.
A straightforward way to do this is with an "impact vs. effort" matrix. This tool helps you sort potential updates into clear categories:
- Quick Wins: These are high-impact changes that don't take much work. For example, updating the title of a high-traffic blog post to get more clicks or adding a new call-to-action on a page where people spend a lot of time.
- Major Projects: These are big-ticket improvements that promise high impact but require a lot of effort. This could be rewriting a guide that's now out of date or producing a video to go with a popular article.
- Fill-Ins: These are low-effort, low-impact tasks you can tackle when you have a spare moment, like fixing a broken link or updating an old screenshot.
- Reconsider: These tasks require a lot of effort for very little return. It's often best to leave these alone and focus your energy on more fruitful projects. You can explore other smart ways to get more value from what you already have through different content repurposing strategies.
Testing Changes to Drive Real Results
Once you know what you want to improve, it's vital to test your changes scientifically. Making decisions based on a gut feeling is a recipe for wasted effort. The best method for this is A/B testing. This involves creating two versions of a single element—like a headline, an image, or a button—and showing each version to a different group of people to see which one performs better.
Tools like the now-sunsetted Google Optimize (many alternatives exist) allowed you to run these experiments to see how your changes affected key metrics like conversions or engagement.
The image above shows a typical A/B test in action, comparing an original page to a new version. By measuring the results, you can make choices based on actual user behavior, not just what you think will work. This data-first approach ensures that the changes you make truly improve your content performance metrics, building a more powerful and effective content program over time.
Advanced Content Performance Measurement Strategies

Moving beyond basic metrics like page views and bounce rates lets you see the full story of your content's impact. Advanced measurement is like switching from a simple road map to a live satellite feed. You don’t just see the roads; you see the traffic flow, the detours people take, and where they ultimately end up. This deeper look reveals how your content shapes customer relationships and drives real business goals.
Sophisticated content performance metrics help you answer bigger questions. For instance, which blog post series is best at turning a new visitor into a paying subscriber? Or how did that LinkedIn post influence a purchase, even if the buyer never clicked a link? Uncovering these insights requires connecting the dots across different platforms and tracking user behavior over time.
Tying Content to Business Outcomes
To find your content's real value, you must connect it to business results, not just clicks and views. This means focusing on metrics that reflect customer actions and financial impact. Two powerful ways to do this are cohort analysis and attribution modeling.
- Cohort Analysis: This method groups users by a shared trait, like the month they joined your email list. By following this "cohort," you can see if content published in June created more loyal readers than content from May. It helps you understand which strategies build lasting engagement.
- Attribution Modeling: This technique assigns value to the different touchpoints a customer interacts with on their way to converting. Instead of giving 100% of the credit to the last article they read, multi-touch attribution spreads it across their entire journey. This shows how an early blog post that built awareness was just as important as the product page they visited right before buying.
Understanding the Customer Journey Across Platforms
Your audience doesn't stay in one place. They might find your article on Google, see it shared on LinkedIn, and later visit your website directly. Advanced measurement tracks this entire cross-platform journey to build a complete profile. Tools like Salesforce Marketing Cloud help centralize data from social media, email, and your site into one unified view.
For example, this dashboard shows how different marketing efforts work together to create a single customer experience.
By bringing these separate data streams together, you can follow a user's path and see how each piece of content contributes to their perception of your brand. To learn more about crafting messages that resonate, check out our guide on business writing tips and tricks.
Putting these advanced strategies into practice requires a new perspective. You need to see content performance metrics not as standalone numbers but as connected clues in a larger story. This strategic view is what separates good content programs from great ones, giving you the clarity needed to fine-tune your entire content system for maximum business impact.
Creating a Performance-First Content Culture
Moving to a data-informed approach is about more than just new tools; it’s about growing a performance-first culture. This changes how everyone, from writers to stakeholders, approaches content. Think of it like turning a group of talented solo musicians into a unified orchestra. Everyone plays from the same sheet music—the content performance metrics—to create something powerful together. The aim is to make measurement a celebrated part of the creative process, not an obstacle to it.
This cultural shift starts when the whole team rallies around the same clear goals. When everyone understands what success looks like—whether it's improving conversion rates or extending the average engaged time—making smart decisions becomes much easier. Accountability becomes a shared mission to improve rather than a top-down directive. This creates an environment where trying new things is encouraged, as teams know that both successes and failures are just data points that help everyone learn.
Fostering Data Literacy and Collaboration
For this to work, your team needs the ability to read and act on performance data. This doesn't mean everyone has to become a data analyst. It's about building foundational data literacy—the ability to understand what the numbers are trying to tell you. Training can be focused on real-world uses, like knowing which metrics are important for different types of content or how to spot a trend in an analytics report.
Collaboration tools are key to keeping the momentum going. Shared dashboards and open communication channels make performance data visible and easy to discuss. For instance, a team could use a dedicated channel in a tool like Slack to post weekly wins and interesting findings.
This kind of setup sparks real-time conversations about performance, turning what could be isolated numbers into valuable team lessons. This ongoing communication keeps everyone motivated and aligned with the group's objectives.
Implementing and Scaling a Performance-Focused System
To make this culture stick, you need solid processes. Regular performance reviews, like monthly content audits, should become a team habit. In these meetings, the team can dig into the best-performing content and figure out how to repeat that success. A straightforward framework for these reviews could be:
- Review Key Metrics: Start by looking at the main KPIs set for the month.
- Identify Wins & Losses: Talk about what content flew high and what didn't get off the ground.
- Extract Learnings: Ask "why" for both successes and failures to find actionable insights.
- Set Next Steps: Agree on clear actions for the next content cycle based on what you've learned.
This structured routine ensures that insights from your content performance metrics are always being looped back into your strategy, creating a cycle of continuous improvement. As your team gets bigger, these documented processes and a shared commitment to data will help you scale the performance-first mindset successfully.
Ready to build a high-performing content machine? autoghostwriter helps you create engaging LinkedIn posts backed by proven templates, so you can focus on the metrics that matter most.